Showing posts with label sp500. Show all posts

Tuesday, October 12, 2010

Market Setup Updated

Get ready for fireworks...a failure of the overhead trendline and control, indicated in red on the chart below, targets 810 to 800. I am currently short EURO from 1.40ish and short TF, EMD, ES and NQ via weekly systems. FYI, weekly trades may add another entry at this friday or next, but the hold time for weekly trades is 3 weeks to 3 months.

Please note that the ten year bond is not confirming the recent highs. In fact this is the largest non-confirmation divergence I have ever seen between Equities and the ten year, indicated in light blue on the chart below...not good.

Tuesday, October 5, 2010

Friday, September 10, 2010

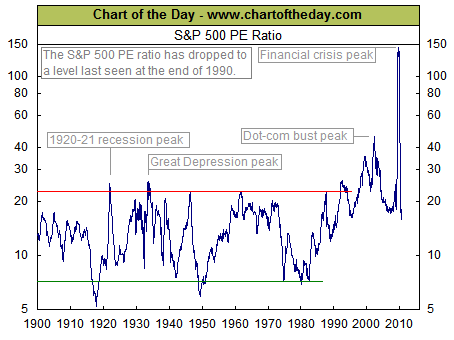
SP 500 PE Ratio Breaks supports...


SP500 PE Ratio has broken supports, next real support is in the 7 to 5 area. When looking at PE's I prefer to look at the Dow, which also has a lot more history. If it is any indicator or where support actually exists, then we are looking in the 3 to 5 area for support for PE ratios.

Wednesday, July 7, 2010

ES Sets Cycle Low


What the significance of the reaction is will clarify as we progress. However the next bearish daily cycle will likely be an important point to examine - which I will do on at that time.

Wednesday, June 2, 2010

SP500 still setup for a short

The S&P500 trading systems are currently looking short. If we get to levels much above here the systems will likely trigger short. I will make sure to post if any of the major index systems do setup and trigger. How it looks to me is that the jobs number on Friday will be a high probability for a short entry. Sell when people are happy and promoting trumped up numbers sounds like a reasonable trade to me.


Below is the chart that I posted last week for easy reference.

Friday, May 28, 2010

SP500 Earnings from 1936

With first-quarter earnings basically in the books (99% of S&P 500 companies have reported for Q1 2010), today's chart provides some long-term perspective to the current earnings environment by focusing on 12-month, as reported S&P 500 earnings. Today's chart illustrates how earnings declined over 92% from its Q3 2007 peak to Q1 2009 low -- the largest decline on record (the data goes back to 1936). Since its Q1 2009 low, S&P 500 earnings have surged (up over 700%) and currently come in at a level that has only been exceeded during the latter years of the dot-com and credit bubbles.

Wednesday, March 3, 2010

Thursday, February 11, 2010

Alternative SP500 Target


An alternative target of the SP500 would be 1095'ish. Assuming we have an ABC up off the lows of a few days ago...wave A measures roughly 35 points, wave B measures about 20 points and with wave C being equal to wave A, that adds another 35 points off the wave B low brings us to roughly 1095. This would be an objective area to scale into shorts with an appropriate stop.

Market Update

Markets have run, with the small caps outperforming...but for all the noise - not much has been accomplished. Below is an update of the SP500 chart I posted earlier. We appear on target to reach the ideal levels in the 1085ish area with this short squeeze rally. There is some minor resistance shown in the chart above those levels as shown by the horizontal levels.  The Russell 2000 looks like it wants to reach its potential. I have not included an update for that index as nothing has really changed.


Below is an example of the RTS system (Real Time Swings Advanced system) run on the SSO today. That resulted in a short for around $600 and a long for $1500 for a risk allocation of $500. RTS finds real reversals on any chart type in real time and suggests entry prices, entry stops, trailing stops along with appropriate position sizing for risk management based on the trade potential.

Tuesday, February 9, 2010

Where we stand

Bearish Rally Signals are being generated...and market structure seems to be complete or in a completion phase. A-B-C bounce has set up nicely on RUT and matches high probability targets. As a secondary potential the same target areas could be met with a 5 wave wedge rather than an A-B-C pattern. The important thing is that we have triggered resistance signals already and it seems do not have that much more upward potential.

Sunday, February 7, 2010

Market Update

Market Cycles caught the move perfectly as you can see form the updated chart. Swing Levels gave us the correct target area for the lows and the End Of Bear Cycle triggered indicating a completion wave was occuring. Bounces to 1080 to 1086 are now on the table.

Wednesday, February 3, 2010

Bearish Rally Action for SP500

SPX setup for a reversal . When a Bearish Rally Signal is triggered by the CycleAnalysis tool ,we should see at least a little pullback prior any attempt to break the marked bearish rally resistance level. Usually, a resulting rally is a failure. Failure targets 1039 on the SPX with upside to 1114 to 1118 as upside targets.

Wednesday, January 20, 2010

Updated Market

GREAT sell signals on the market this AM...


As of 12:00 this is the view...got good bounce signals...predictive pivots point lower for the close


Update as of 12:50 Est:


Update as of 3:59 EST:


If anyone is interested...I would consider setting up an alert serivce based on the triggers in any of these charts...please let me know by contacting me through email or comments. If there is enough interest...I will put the work in or perhaps do a webinar type screen sharing session.

Looking for feedback...

Tuesday, January 19, 2010

Current Market Overview

Looks like one more push and then a roll over...should be a pretty good move. Predictive pivots in the indexes argue for selling into the close...These are indicated by the little Red lines on the right of each index. they are significantly below currnet prices...argues for downside this afternoon towards those levels... internal volume trends are not particularly good.


And here is the close: I posted the series of charts so you can see how well the systems track price...also the predictive pivots did indeed turn in to the magnet that I indicated above.

Friday, November 20, 2009

SP 500 Earnings..in persepctive

With a large majority of third-quarter earnings in the books (87% of S&P 500 companies have reported for Q3 2009), today's chart provides some long-term perspective to the current earnings environment by focusing on 12-month, as reported S&P 500 earnings. Today's chart illustrates how earnings declined over 92% from its Q3 2007 peak to its Q3 2009 trough, which makes it easily the largest decline on record (the data goes back to 1936). On the positive side, S&P 500 earnings bottomed and are moving up sharply.

Monday, November 16, 2009

Market Observations - Under the surface - not what it appears to be

Just like Bernake, if you look under the surface you can see that there is something masquerading as an impostor you always knew was lurking. Well, in my charts below you can see, this rally is not what it is cracked up to be. Additionally, we only need the box trades to close on both the ES and TF for the market to be set up for, at the least, a major pullback. Would be nice if the dollar could get into the 74.50 and below or above trendlines, confirming an unsustainable position in the markets.


Sunday, November 15, 2009

SP500 Futures Explained...

Here's a brief description and background on the E-Mini/S&P 500 futures contracts, since we get asked practically every day what they are.

A Brief Introduction

The Chicago Mercantile Exchange (CME) introduced the S&P 500 futures contract back in spring of 1982. The S&P 500 futures market has now become today's most actively traded equity futures contract. The S&P 500 futures contract represents roughly 90% of all US stock index futures trading. The S&P 500 is comprised of the largest 500 listed stocks, therefore allowing you to easily and effectively buy or sell an extremely well diversified portfolio of stocks in one stock index futures contract. This allows you to make trading/investing decisions based on your overall outlook of the stock market. Here's a couple advantages of trading the S&P 500 & E-Mini stock index futures contracts:

You can easily participate in broad market moves, with one trading decision (one chart to look at) - instead of having to choose individual stocks (looking at many charts).
You can easily protect the value of a portfolio during adverse markets without incurring high transaction fees.

In October 1997 the E-Mini S&P 500 futures contract (symbol = ES) was introduced - which is the same as the S&P 500 (symbol = SP), except it's one fifth the size in terms of point and tick size, discussed shortly.

Exactly What Is The S&P 500 Index?

Most all of you know what the Dow Jones Industrial Average (DJIA) Index consists of; The DJIA is made up of only 30 blue chip stocks. The S&P 500 index on the other hand is based on the stock prices of 500 different companies - generally 76% industrials, 12% financial institutions, 10% utilities and 2% transportation. As you can readily see, the S&P 500 is much more representative of the overall market than that of the DJIA. Also, the market value of the 500 firms that comprise the S&P 500 index is equal to roughly 80% of the value of all the stocks that are traded on the New York Stock Exchange.

The Value Of The S&P 500 Futures Contract

The value of the S&P 500 futures contract can be calculated by multiplying the futures price by $500. For example, if the S&P's are trading at 1089.50, the value would then be $500 X 1089.50, or $544,750. The minimum price fluctuation (tick) for the S&P's are .10, so a tick up or down is worth $25 per contract. A full point has 10 ticks in it, which is worth $250 per contract (.10 X $25 = $250). The E-Mini S&P 500 is on the same price scale as the regular (full) S&P 500, the difference lies in the tick and point values. The E-Mini S&P trades in .25 ticks and is worth $12.50 per tick; and a point is worth $50 ($12.50 X 4 = $50). As you can see the E-Mini's are one fifth the size of the full S&P 500 contract.

As you can readily see by now, since the S&P 500 futures market represents roughly 90% of all US stock index futures trading, you can use the S&P 500 futures contract to try and forecast the market's overall direction. You can in turn position yourself with a profit from such a move. That is, of course, if you're right on the market move.

What Are Futures Contracts?

A future's contract is an agreement between the seller and buyer to respectively deliver and take delivery of a commodity at a specified future date. But in the case of the S&P 500 futures contract, the commodity is a portfolio of stocks represented by a stock price index. The delivery is actually a cash settlement of the difference between the original transaction price and the final price of the index at the termination of the contract. More accurately, the cash settlement occurs in the increments daily until the termination of the contract, as the contract trading price changes.

The futures contract price responds to the changes in the overall underlying index, with the index recalculated as the component stock prices change. The prices of the futures contract looks very similar to the index price itself; the future's price may be higher or lower than the index itself. While the future's price does not move point-for-point with the index, it does track it closely enough to act as a very effective proxy.

How Much Does It Cost To Trade The E-Mini's and S&P 500?

The margin requirements to trade the S&P 500 is quite small compared to the overall value of the contract itself. Margin requirements to keep the S&P 500 Overnight (you need roughly $22,000 per contract to keep an S&P overnight) is much more costly than it is to Day Trade the S&P 500 (you need roughly $10,000 per contract to day trade), but it really depends on the discount futures house that you trade through. The firm I recommend only requires $5,000 to day trade the S&P and $12,000 to keep an S&P overnight. The E-Mini S&P's on the other hand are much less expensive to trade. It costs roughly $2,500 to day trade the e-mini S&P's and roughly $7,500 to keep an e-mini S&P overnight. We highly recommend to all students to start off trading the e-mini S&P's (if you ever decide to trade them) until you fully understand what they're doing before moving on to the full S&P 500 contract. We think that's a smart move for anyone just starting out.

Future's Risk

Please Remember: Trading the E-Mini's & S&P 500 markets (or any market for that matter) are not without risk and as a trader/investor you must accept the possibility of being incorrect in your predictions (trades) of the market. The opportunity to profit from trading futures can be very substantial, however keep in mind that the risk of trading futures can also be very substantial. And please remember, any market you decide to trade you must use stop losses (ISL's) - as you already know by now this will help limit your losses to your own personal comfort level .

"Why trade the full and E-mini S&P 500/Dow or Nasdaq futures markets?"

  • There is NO market research required.
  • *Futures margin requirements are a fraction of those needed for day trading stocks ($2,000 vs. $25,000).
  • You can profit no matter which way the market moves, up or down. Bad market news can be real good news to you.
  • Great potential for daily cash flow.
  • Tremendous leverage, liquidity and daily volatility for maximum profit potential.
  • There is NO Up tick rule.

    Thursday, November 12, 2009

    Another View of the Dollar Carry Trade


    The slightly upward sloping channel needs one more little pop to fill. I saw a great chart of this earlier today...but I think the trend lines needed to reflect the channel. Nice moving average resistance above also.

    those of you with stockcharts may want to watch this chart live, enclosed is the link to the live chart. live chart

    Saturday, October 31, 2009

    Dollar Analysis - much focus on market bounce - evidence not compelling

    Every where I see people looking for a market bounce, while evidence may support a very small one, keep in mind that the dollar did not even take out Thursday's high on Friday while equities got pummeled. From what I see, a pullback in the dollar has maximum potential of around 75.90. That is the dashed support line on the chart below. If the dollar were to take out that level, it would likely be taking out swing lows from the left shoulder and that would be a SIGNIFICANT compromise to the technical picture.

    What seems most likely to me is that the dollar makes a small pullback above this support and then breaks out or simply gaps up over resistance at the thick green line. This of course would likely support a market that would cascade lower to the 1016 to 1020 area at least, probably more prior to a good bounce. If we look at the downside risk for the dollar its so minimal that any market rally would have to be rather restrained at best. Again, if the dollar were to take out 75.90 then something else would be playing out.

    The thick green trend line immediately above for the dollar is a significant resistance, but the pattern is strong and looks like it is demanding follow through and then consolidation. A breakout of this trend line will cause an avalanche of dollar shorts to cover... potentially in explosive fashion.

    Looking at past action in the dollar, pullbacks during the first short squeeze higher are extremely small and more likely gap ups. I will post some examples shortly.

    Please click on chart for a sharper view.


    Friday, October 30, 2009

    Market Observations - Dollar Poised

    The dollar is poised and ready...just below key resistance. Ironically, most are looking for a bounce...if the dollar does breakout...then we will need to be looking for a cascade lower. So far, the dollar has guided me very well through this current pattern. Right now, I favor a small bounce followed by a dollar breakout and an equities cascade lower. What this means is that immediate resistance may provide a convenient point for some dollar selling or consolidation...and we can not underestimate how minimal that may be. Once this resistance is broken the effect will be a strong rally for the dollar and heavy selling of inflation assets. SP 500 targets for me on this move will be 970 area with a hesitation at the 1016-1020 area.

    EURO divergence has been and will likely continue to be a great trigger for trading and has revealed the dollar and market patterns prior to them occurring - sometimes by as much as 30 minutes. It is currnetly my primary trade setup vehicle. If there is no divergence between the EURO and the SP500 I do NOT do a trade.

    The fractional reserve system is dead...and the impact of that will be an exploding dollar. Which is why we have to worry about the impending breakout on the dollar chart. To understand more about this subject please read the feature articles posted on the upper right on this blog.

    Below is an unchanged old chart of the SP500 that I posted over the last few weeks.


    Below is a very good chart from Matt Fraily for the UUP.


    Below is an unchanged old chart of IWM that I posted on the 21st of September.


    Below is a chart of Oil that I have been monitoring over the long-term. 

    First resistance held...we have not yet made it to the upper resistance which is around 87 to 90...which is rather disappointing for the pattern. Depending on next week's action in the dollar, we will see if there is any upside potential remaining.


    The Gold Equities GDX chart below this is from Matt at breakpointtrades.com and demonstrates that gold stocks are leading physical gold, as they usually do. If that is the case, any bounce for commodities will be muted.


    Below is another chart from breakpointtrades.com of the SPX.

    I do not love the count of the wave 4 as it is labelled. But I do think that we are putting in some sort of triangle or flat here for wave 4. This is appropriate alternation and may reflect what the dollar chart seems to indicate - which is that an upside breakout on the dollar will make equities want new lows before we get a sizable bounce.

    above chartcourtesy of matt fraily, breakpointtrades.com
     
    © 2009 m3, ltd. All rights reserved.