Saturday, February 26, 2011

Fraud on a massive scale - the deception of the Banks, Washington and Obama

Why are the only people going to jail NOT members of the financial and government elite...Jullian Assange for example...We should be prosecuting Ben BURNanke, Tim G-heist-ner and the criminals at Bank of America to name just a few.

The irony of our times, is that to get real and quality news jouranlisim on television you have to go to the Comedy Channel, Aljazeera and Russian Television in the US before CBS, CNBS, MSNBC, Fox News or CNN.

The Colbert ReportMon - Thurs 11:30pm / 10:30c
Corporate Hacker Tries to Take Down WikiLeaks
www.colbertnation.com
Colbert Report Full EpisodesPolitical Humor & Satire BlogVideo Archive
The Colbert ReportMon - Thurs 11:30pm / 10:30c
Corporate Hacker Tries to Take Down WikiLeaks - Glenn Greenwald
www.colbertnation.com
Colbert Report Full EpisodesPolitical Humor & Satire BlogVideo Archive

Austan Goolsbee - a goon who does not get it and Administration that does not know we know they don't get it. I can't believe that they let this guy out of the basement.
The Daily Show With Jon StewartMon - Thurs 11p / 10c
Austan Goolsbee
www.thedailyshow.com
Daily Show Full EpisodesPolitical Humor & Satire BlogThe Daily Show on Facebook

Hard to believe that Rumsfeld forget most of what he ever said and is now trying to rewrite history...Jon does an amazing job with this interview and Donald Rumsfeld is clearly not comfortable but he will do anything to whore for a few bucks
The Daily Show With Jon StewartMon - Thurs 11p / 10c
Exclusive - Donald Rumsfeld Extended Interview Pt. 1
www.thedailyshow.com
Daily Show Full EpisodesPolitical Humor & Satire BlogThe Daily Show on Facebook
The Daily Show With Jon StewartMon - Thurs 11p / 10c
Exclusive - Donald Rumsfeld Extended Interview Pt. 2
www.thedailyshow.com
Daily Show Full EpisodesPolitical Humor & Satire BlogThe Daily Show on Facebook
The Daily Show With Jon StewartMon - Thurs 11p / 10c
Exclusive - Donald Rumsfeld Extended Interview Pt. 3
www.thedailyshow.com
Daily Show Full EpisodesPolitical Humor & Satire BlogThe Daily Show on Facebook

Russell 2000 setting up out of expanding wedge


Revisiting Apple...

So far the nasdaq 100 has been showing relative weakness versus the Nasdaq as a whole and AAPL in particular has been showing relative weakness versus the 100. This could be a sign of vulnerable market and certainly puts the bounce so far on shaky ground. Based on the window dressing and still unfilled gap at 350 on this chart I would think we get more testing and a continue to attempt a fill of the lower gap on Monday followed by selling into the close of the day and month if upside momentum does not get some volume behind it.

Friday, February 25, 2011

Some thoughts on the Financials...

I will be posting some more detailled views of the markets, especially this bounce, this weekend. One thing I would like to send people into the weekend thinking about is financials. All the big financials had unhealthy action today in addition to not closing at the highs as the major indexes did. It was not good. WFC, C, JPM, BAC, AIG, GS...and a host of others all posted bearish chart patterns that look like they are going to resolve soon...start doing some research...additionally this pennant looks like a continuation pattern...its about to get interesting by the looks of things.

Additionally, the transports did not have an especially strong day either...

Have a great weekend.

Testing, Testing, Testing...this is NOT a drill.


Some little thoughts for tomorrow...

Everyone and their brother, mother and grand-mother has been watching the "incredible, death defying VIX 2-Sigma buy signal". I would like to point out that this market has had a way of fooling many commonly accepted interpretations of signals such as Hindenburg, the VIX, Put/Call and Bullish percent signals. While it would be nice to see this a signal actually work for a change, the past VIX signals have been less than spectacular and stand a very good chance of continuing to be unpredictable or unreliable.

Additionally, I prefer to use log charts and on log charts all the bearish wedges have broken out to the downside as you can see from my SP500 chart posted earlier this week. As a recommendation, I would consider setting up charts in both Linear and Log Scaling for any index that you may be analysing as this will clue you into what the markets are seeing more as a whole. Some people prefer the linear charts some the Log charts. Its good to be aware of both.

I am posting these comments, as there are considerable cross winds in the markets here.

Here's a look at the wedge target os a rather sloppy pattern on the ES 24 hours globex futures contract. Keep in mind that this patten only appears on the futures contract...the cash market does not reflect this pattern at all. But sometimes this is somewhat useful to setup target ranges...


Here's a look at another pattern that is much better and also the rage lately with all the conflicted market action and internal dissonances...the Megaphone or expanding bearish wedge...

Former leaders are cracking...lets look at Apple

Thursday, February 24, 2011

Wednesday, February 23, 2011

This ISN'T working...

A view of the S&P500...

Its funny, post history everyone will want to blame a sell off in the markets on Libya. The reality is that the Mr. Market has a mind of his own that is very difficult to understand. Sometimes he wants to go up when there is only bad news and even while Egypt wants to rebel and put at risk the largest oil stores in the world and sometimes he wants to go down when a little country with a relatively small amount of Oil contributed to the world oil markets is also falling into revolution. The reality, is that the markets were going to go down regardless of Libya and seemed to want to go up regardless of the any reasonable analysis of Benny BURNake and the Ink Jets, the Banks, the manipulated data or the vast amount of unemployment. Below is an example of why...a 35 year trend line can do the trick especially when combined with a 75% retracement from the highs.

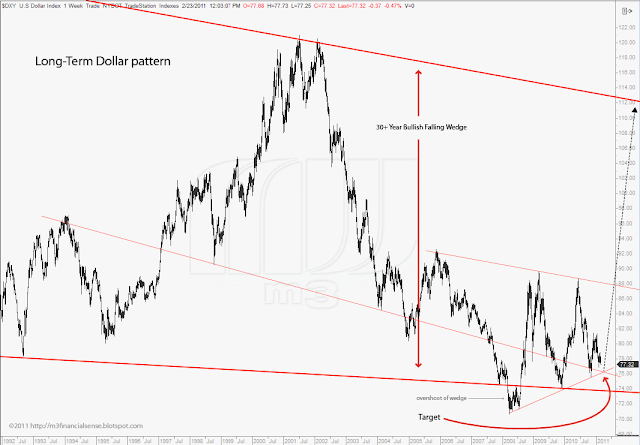
The Dollar the REAL story...not this dollar collapse scam...

Click on charts for a more detailled view.
For more information please read this post: Dollar Scenario

Tuesday, February 22, 2011

ES Channel


Monday, February 21, 2011

Oil to $200...really?

On the chart I refer to a breakout of -82. That really means a breakdown below 82 in real life - could be rather bearish for oil. That's the inverted interpration based of the chart and in polarity with the real market. This is a very high level view of Oil and it is likely that we test this pattern (the lower trendline) before breaking out. Contrary to popular expectaton, the breakout will likely be in the direction of long-term and substantially lower Oil prices after a test of 110 or so in the CL market.

Key Pattern on SP500 Breaks

Sunday, February 20, 2011

The Presidents Day Effect

I hope everyone is having an enjoyable President's Day weekend...it is an interesting reference point for the market. Usually, if the market has been able to rally into President's day, especially closing near the highs...that's a marginally bullish sign for the outcome of the year. However, this time around things are a little more interesting. First of all, we are trading on abysmal volume (potentially the lowest monthly volume in 5 years)  at EXTREMELY stretched prices...and second during EXTREMELY unpredictable times.

In the past history, when we have traded this strongly into this time of year that has bode well for the rest of the year...except when we do so on paltry volume and over extended prices...in both of those cases...in 1937 and in 1931...the results were spectacular and resulted in over 40% declines for both years. The average return for entire year in which we trade into Presidents day strongly is 14.46%. We are currently up 7% for the year...that leaves us a potential, if the internals for the market were strong, of another 7% gain by the end of the year...or alternatively the potential of a 55% decline, as in 1931, if the market internals are a masquerade.

Here is a chart...


Nasdaq 100 chart revisited

I am re-posting in this blog entry (not inspired by Steven Colbert Colbuffington Re-post) with additional markups on the chart and comments because some people seemed to not understand that the significance or my the markings on the chart. The two red trendlines are exactly the same number of points. This indicates a classical type of market symmetry in that the bounce from 2003 is almost exactly equal to the bounce from the 2008 low...additionally, there is minor but not insignificant time symmetry also which is indicated by the comparison at the top of the chart. Markets love to behave symmetrically and this one on the Nasdaq 100 is a very strong pattern indeed.


I will be posting a few new charts and observations tomorrow...

 
© 2009 m3, ltd. All rights reserved.