We stand at the precipice after a significant reversal in US treasury market rates…if history since Bretton Woods is any guide the results this time of the 7 month cycle lag for recent increasing rates will not be pretty at all and most likely much worse than any other reaction on this chart. The FED is NOT all powerful and this chart proves that.
This is a very large chart. Please click on it to zoom in…you may have to click again once it loads to see one to one resolution.
Click Here for the highest resolution version of this chart
Now that was a show. Ben and his band of manipulators were in full regalia this week…leaving the markets in perilous positions. As it turned out, the 80% of the traders who thought the market would be up this week, voted correctly. As I had made clear on these pages, I was expecting a reversal on the jobs report - which did not happen. However, the picture is now more clear and more dangerous.
The volume for the week was abysmal. Sometimes makes me wonder if the Fed is not directly purchasing shares in one of their many unnamed accounts at JPM and somehow messing with the markets in ways that we are of yet unaware. I am certainly NOT of the belief that one should take very much of the hyperbole, data or claims from the FED at face value. Take for example the Jobs report even though it is not emanating directly from the FED. I am quite sure that preparation of these numbers has been very well engineered. The FED needs to have the unemployment rate dropping to have any chance at the perception of credibility. This jobs report accomplished that. However, Americans not in the labor force increased 296,000 between January and February and incomes continued to decline. What we can see here is that the powers that be will continue to paint the numbers until it is impossible to do so any longer because some undeniable amount of the population is unemployed yet they are still showing a declining unemployment rate. If 40% of the US population is unemployed but the supposed workforce has dropper appropriately, the BS (BLS), will still be able to get to the magical 6.5% unemployment rate…all while government revenues decline and entitlement continue to expand. It is utterly incredible that this jobs report at best created very few jobs and on its face actually lost around 60,000 jobs, yet its promoted, pumped and ironically not dumped in the markets.
I have no doubt that the jobs report will be dumped as the anticipated pumping now progresses to the void in the official disinformation campaign. Meanwhile, the markets sported nasty candle closes, ridiculous optimism of 83% for the S&P500 and 85% for the NASDAQ) and unsustainable technicals…and all of this on no volume and a horrid jobs report and record Fed intervention and bank injections.
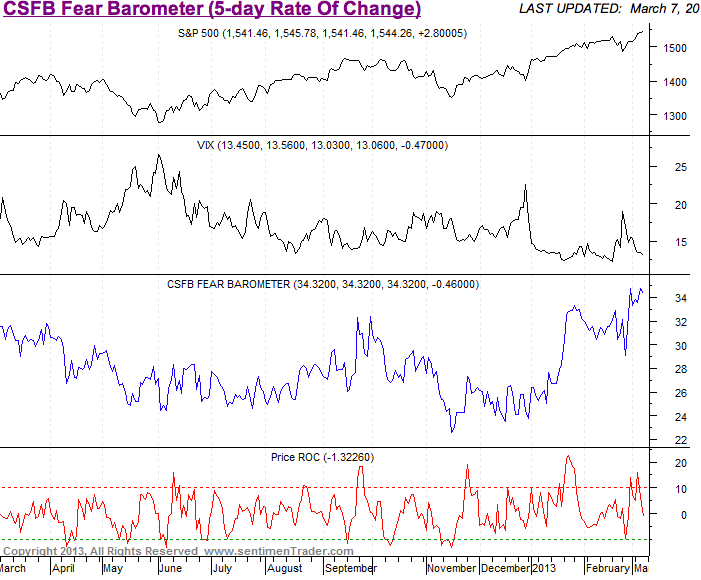
Treasuries are testing their broken wedge, VIX failed to make a lower low and the NASDAQ and the Transports failed to make a new high. This is a mess and will not be ending well. Additionally, Apple Computer has failed to bounce at all, and is prone to a break of support here which will target the $220 area. Still seems amazing to see that reversal from 700 to 200ish as even a plausibility for an inefficient market. But this is a FED incented market and they apparently have taken their employment mandate to manipulated employment numbers, prices and interest rates very seriously by creating bubbles and leverage in any corner willing to accept it.
It is truly amazing to me that the official jobs report represented jobs created by simply ignoring and not counting the destruction of 296,000 jobs. It just astounding that they are willing to essentially double (or worse) new jobs and present it as a viable and true number.
As I indicated early in the week, 80% of participants thought that this week would close up - they usually turn out to be wrong and though most are thinking an up close for the week is in the bag…if pattern holds true that may still not be the case. In addition we had two cycle top dates this occurring week and ADP is often disinformation with regard to the actual jobs report. It is almost an irony how in effect distracting or softening the effect of the actual report - we will see if that curious relationship holds again. Meanwhile, NASDAQ sentiment closed the day in the 95 percentile and the S&P 500 sentiment closed in the 90 percentile. Below are some more market measures that show context for this weeks aberrant trading. Dow and S&P closing above the bollinger band for 3 days in a row.
Even the most optimistic jobs numbers will likely not be to the markets pleasure...
80+% of traders think the market will close positive this week…they may have been right yesterday and today…but the close of the week is another story entirely
The current hysteria reminds me exactly of the hyperbole being spouted when Apple was 700…and there were not many buyers of Apple left after everyone bought into the hysteria on margin no less.
Why are interest rates so low? I could choose to address another question as a parallel. Why are people in the US 26 pounds overweight?
Lets examine how that second question has been and can be answered. "People in the US are 26 pounds overweight because they have a high fat diet and do not exercise sufficiently." That sounds like something I could sell to a broad array of people without much argument. Or how about this: “People in the US are 26 pounds overweight because they work sedentary jobs and drink too much alcohol.” Or, “People in the US are 26 pounds overweight because they eat too much dairy and an increase in the rate of diabetes”. Or, “People in the US are 26 pounds overweight because their diets are too high in carbohydrates and meat”. Or, “People in the US are 26 pounds overweight because eat too much”. Ok…I’ve put out a bunch of reasons each of which have cursory but largely distracting merit in determining why people are overweight in the US. The real reason that people are overweight by 26 pounds is actually totally different…if you would like to understand the answer you can watch this video:
Ben BURNanke is a salesman apparently trying to sell his way into a Nobel Prize for economics he does not understand. His reasons for identifying why interest rates are so low is about as relevant as any of the individual reasons that I wrote above for people in the US being fat…and entirely useless.
Below is a quote of BURNanke’s pre-Nobel Prize marketing tour/victory lap:
Let's recap. Long-term interest rates are the sum of expected inflation, expected real short-term interest rates, and a term premium. Expected inflation has been low and stable, reflecting central bank mandates and credibility as well as considerable resource slack in the major industrial economies. Real interest rates are expected to remain low, reflecting the weakness of the recovery in advanced economies (and possibly some downgrading of longer-term growth prospects as well). This weakness, all else being equal, dictates that monetary policy must remain accommodative if it is to support the recovery and reduce disinflationary risks. Put another way, at the present time the major industrial economies apparently cannot sustain significantly higher real rates of return; in that respect, central banks--so long as they are meeting their price stability mandates--have little choice but to take actions that keep nominal long-term rates relatively low, as suggested by the similarity in the levels of the rates shown in chart 1. Finally, term premiums are low or negative, reflecting a host of factors, including central bank actions in support of economic recovery. Thus, while the current constellation of long-term rates across many advanced countries has few precedents, it is not puzzling: It follows naturally from the economic circumstances of these countries and the implications of these circumstances for the policies of their central banks.- Ben Benanke
I have never heard such baseless drivel. Lest we forget the charts I posted this weekend, Ben BURNanke is a not just marketing his Nobel Prize candidacy, he is selling something else too: CREDIT. This can clearly be seen in my charts in the previous posts…and apparently he has done a reasonably good job with his unfortunate task. The reality is that the money supply IS credit and he desperately needs people to take on credit just to even enable the settlement of previous credit without default. So, there in the end is a simple reason that governs rates…the amount that someone is willing to charge to issue credit and the rate that a credit worthy borrower is willing to avail himself of it. And there you have it…there are NO other factors. The FED is one of the participants, and as you can see, actively moves the price of credit in all sorts of ridiculous ways.
When you have very little demand for a product what happens? Its price drops. In the case of credit, price equals rate - and there is precious little demand for credit among worthy borrowers, in order to induce them to borrow you must lower the price of the product. This is certainly counter to what should be going on, as the economic risk increases globally, risk of failure, even by worthy borrowers increases. I certainly would not lend money to anyone for 2 or 3 percent in today’s environment. However, if that was my only product offering and there was such little demand, I would be forced to.
There is one more reason that rates are so low and that relates to central banks, governments and institutions who are too large to simply deposit money with a bank and expect its safe keeping and return. If you want to be sure you get your notional deposit back you need it to be in unqualified original currency - in the case of dollars, US Treasury Notes. Many, Many people are concerned with the safe keeping of large amounts of dollars and know that these dollars are NOT safe in the banking system anywhere on deposit and, therefore, must accumulate an array of government debt as a store of their currency. If you have a lot of people willing to buy notes issuing credit to the United States then rates will be very low indeed. This is why i have maintained for a long time that yields on Treasuries will actually not just calculate out to negative yield but in some cases actually go to a negative listed yield.
So, what we essentially have with Ben’s exmplanation is a salesman trying to tell us "people get fat because they get up too late, sleep on their stomachs and don’t play golf”…if you wish to believe him, do so at your own delusion.
Ben BURNanke and Mario DRUGhi want people to be motivated to take risk with their capital and not unrelated they would like them to borrow money as well. As you can see, that has been very successful as far as an initiative is concerned. Results are another thing entirely. The results are that there are people who are so starved for a return that they feel they need more and more leverage (borrowing) to get it and are now setup to be black swan’ed. People are now taking risk and then they are amplifying in hugely. Perhaps the inherent risk to people is now 4x to 8x of what it normally would be. A recent example of what happens when people take this kind of leverage is what happened when people pyramided positions in silver right into the $50 handle. That was followed by an obliteration when we gap opened in the low 40’s and proceeded to the upper 30’s nearly instantaneously.
One of the things with leverage is that you can not exactly tell how it will wind and unwind. Unwinding of leverage can happen via a rise in asset prices and closing of short positions or a fall in assets and a closing of long positions. In either case, leverage is very likely to be visible in patterns such as broadening patterns and wedges. The volatility foot print of our markets is an exact leveraged one…the house of cards is only needing a little breeze to start and a mosquito to arrive.
I use Multicharts Charting and Backtesting Software.
I post high resolution charts made with Multicharts and Adobe Illustrator. Click on chart for a more detailled view.
If you do wish to contact me or have any questions you can do so at m3analytics@gmail.com
At The Money: Investing in Wheat
-
At The Money: Investing in Wheat (July 22, 2026) Do you want to own a
core food staple as a geopolitical hedge, an inflation offset, or simply as
a d...
Cronyism: The Origins of the Federal Reserve
-
The Fed was sold as a check on Wall Street's power. Wall Street's share of
the nation's bank reserves went up after it passed, not down. Patrick
Newman on ...
This is the End and a New Beginning
-
I've been thinking about this for some time.
After 21 years of writing this blog almost daily, I've decided to stop
writing the daily updates on the blog.
...


