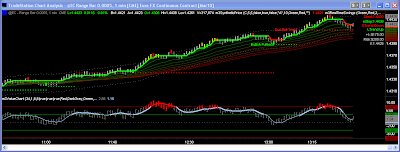
The signals on the chart for the lows and highs occur with in 1 or 2 bars max from the turn point and the smoothed price is a synthetic price that is slow when the market is slow and fast when it is fast - keeping you in the trade...the value chart below is a great confirmation for the high reward low risk trades. Also, the cycle analysis give you good feed back on breakouts and end of trend potentials. Yellow candles represent higher risk in the direction of trade.
Coffee Break: Bari Weiss’ CBS Not an Auspicious Beginning to Total Info
Control
-
Bari Weiss' CBS tenure so far shows that for Larry and David Ellison,
buying a media empire is one thing, imposing total information control is
another.
6 hours ago


